
The Art of the Craft
28 Mart 2022 2022-03-28 9:22
The Art of the Craft

The Art of the Craft
According to eMarketer’s Nov 2021 report, the total worldwide ad spending in 2021 was set to reach $780.59 billion by year’s end 2021[1]. The majority, i.e., 63% of this total, goes to digital ad spending including search advertising. In search advertising, search engines such as Google, Yahoo, and Bing auction ad slots placed in search results pages to advertisers, who compete for displaying their search ads in these ad slots. Each ad slot corresponds to an ad position in the sponsored ads section. Search engines predominantly use the cost-per-click (CPC) model for charging advertisers. In CPC, an advertiser decides the maximum amount she is willing to pay per user click, and is charged each time a user clicks on her ad.
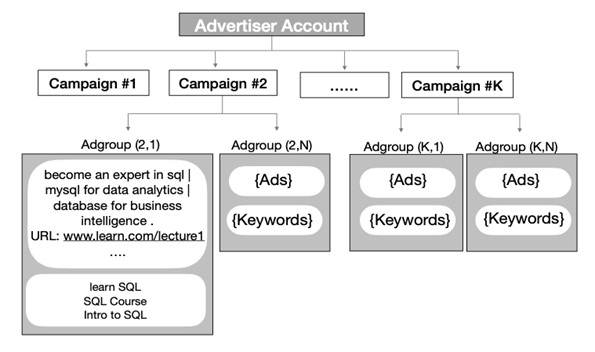
Figure 1. A search campaign consists of a set of ad groups, each of which contains a related set of text ads and keywords.
Using web services provided by search engines, e.g. https://ads.google.com, advertisers create search campaigns that target search networks. A separate ad campaign may be created in order to advertise each separate product, service, or an offer. A search campaign consists of a set of ad groups, each of which contains a related set of text ads and keywords as shown in Figure 1. An advertiser places similar keywords, which are most likely to appear in user queries (or as user queries themselves), in an ad group along with text ads that contain a marketing message and a target URL. The text ads are what gets shown in ad slots. The target URL is used to redirect users post ad-click to a product’s landing page.
When a user submits a query to a search engine, the search engine identifies all eligible ads. An ad residing in an ad group is considered as eligible if at least one of the keywords in its ad group matches up with the user’s query. All eligible ads are included in a real time ad auction held by the search engine. The winners of the auction, which is capped by the number of available ad slots, are displayed on the search results page to the query. Note that the query matches to a keyword, but its corresponding ad is displayed on the search results page.
The total number of clicks that a keyword has received divided by the total number of times an ad has been shown for that keyword represents the keyword’s click-through-rate (CTR). The CTR of an entity represents its click appeal to users. An ad’s CTR, on the other hand, is the total number of clicks it has received divided by the total number of times it has been displayed. An ad accrues its click statistics across all keywords in its ad group. Note that the same ad might have served multiple keywords in its ad-group. In a similar way, multiple ads might have served the same keyword in their ad-group. This crossover conceals the pure statistics of appeal for each campaign entity whether it is a keyword or an ad.
In the CPC model, the search engine gets paid for each user click. Since the revenue of a search engine depends on the number of user clicks it charges to advertisers, the search engine needs to know an ad’s expected CTR in order to display it in the correct ad slot. High quality ads with high CTR and with hefty bids are expected to win the top ad positions for higher ad revenues. Therefore, predicting the expected CTR is critical to a search engine.
On the other hand, the advertiser revenue depends on user actions post click. An advertiser gets paid when a user both clicks on her ad and makes an online purchase. This desired post-click action is called conversion. Since the advertiser is charged for each user click irrespective of a conversion downstream, she needs to know the expected conversion rate (CR) of a keyword or of an ad, i.e., the expected number of conversions per click.
Suppose that we run an ad campaign consisting of a single keyword in order to sell our product online for a monetary value of $150 per unit. Each time a user clicks on our search ad, there is an associated cost per click. Assume that 100 users clicked through our search ad, and only 2 of them ended up purchasing. Our monetary gain during this period is $150 x 2 = $300. In order to gain this much, we bought 100 user clicks. Our return on investment (ROI) from this campaign is equal to:
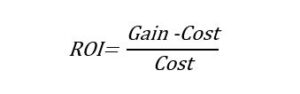
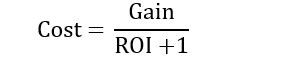
where gain represents the total gain and cost represents the total cost of clicks. We can rewrite the above formula as Cost = Gain / [ROI + 1], which suggests that we can cap the cost according to the projected gain and the target ROI. If the ROI is expected to be above 30%, then the cost must not exceed $300 / (1 + 0.3) = $231 (rounded). In other words, the cost per click must be at most $231 / 100 = $2.31. This cost per click value should be used to set the maximum CPC also known as the bid for the keyword in search auctions going forward. The max CPC bid can also be expressed in terms of CR, ROI, and the value of conversion as follows:
 If we divide both sides of the equation by the number of clicks received, we get:
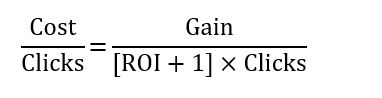
The cost over all clicks gives us the cost per click, i.e., CPC, by simple arithmetic. The left hand side of the above equation is indeed equal to CPC. The gain is equal to the number of conversions multiplied by the value of each conversion. If we replace these terms in the above equation, we get:
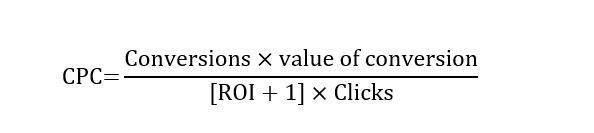
By rearranging the terms on the right hand side of the equation, we get:
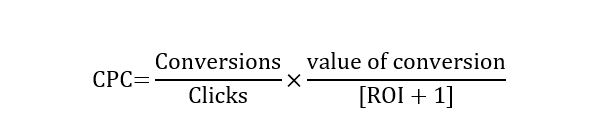
Since the number of conversions over all clicks is the definition of CR, we can replace it and get the following simpler equation:
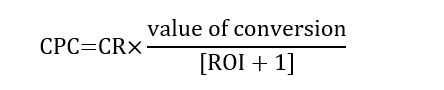
There are knowns and unknowns in the above formula. The value of conversion and the target ROI are known because we set them. The unknown is CR. The above equation suggests that if one can “estimate” CR reasonably well, then one can also set the CPC bids accordingly so as to meet the target ROI.
In order to manage ad campaigns effectively, online advertisers have to know the rate of their online advertisements getting user clicks, i.e., CTR, and the rate of those users converting post clicks, i.e., CR. Both clicks and conversions correspond to user response. The goal in a marketing campaign determines the right target response. The target response is user clicks for raising brand awareness whereas the target response is user conversions for direct sales and profit.
For rate estimation, one could use traditional machine learning methods or deep learning methods [2-3]. A key take-away from these studies is that although more complex models may have (slightly) better logarithmic loss (more accurate), practitioners should use simpler methods such as feature hashing combined with logistic regression since the performance gap can easily be overcome with more training data and with more features. This is because simpler methods lend themselves to scalable model training. In a fast iterations driven world, more number of iterations is more important than a small number of slow iterations with seemingly better results.
Failing fast to learn what works drives the evolution and the fate of digital goods and services. It’s utterly vital to get users feedback to learn from. Sometimes it is much better to work with a solution that is approximately right than one that is dead sure wrong. The experimental nature of such iterative decision mechanisms is outlined by the multi-armed bandits[4]. The exploration and exploitation trade-off calls for learning the rate of conversion via iterative guesses made based on the imprecise information supplied by the bandit, all the while learning the true rate of conversion with more iterations, i.e., trials.
The trade-off gave rise to the popularity of A/B testing to find out the best option among many. The key idea is to learn from the data. If there are two contenders in any given situation, then having a set-up where both contenders get an equal chance to serve the next customer in line would eventually accrue enough statistics to choose the winner using calibrated estimates. As W. Edwards Deming aptly put, “In God we trust. All others must bring data.”
References
[1] Cramer-Flood E. Worldwide ad spending 2021: A year for the record books. Available at https://www.emarketer.com/content/worldwide-ad-spending-2021-year-record-books
(last accessed in March 2022).
[2] Bulut A, Koçak B, Köse S. K, Sağoğlu O, Tilbeç H. (2017). An Empirical Analysis of the State of the Art in Response Prediction. Informatika 45, 27–32.
[3] Almasharawi M, Bulut A. (2022). Estimating User Response Rate using Locality Sensitive Hashing in Search Marketing. Electronic Commerce Research 22, 37–51.
[4] Chapelle O, Lihong L. An Empirical Evaluation of Thompson Sampling. 25th Annual Conference on Neural Information Processing Systems (2011).